
Get upto 50% off in New Year Offer
Get upto 50% off in New Year Offer
 Down
Down

In today’s digital world, capturing and retaining an audience’s attention is more challenging than ever. With content coming at them from all directions, consumers have adapted to skim content quickly rather than slowly absorbing every detail.
This means content marketers must present information creatively to stand out and get noticed. One highly effective method is using infographics, and visual representations of data and information.
Infographics allow you to boil down complex topics into easily digestible nuggets of information paired with eye-catching graphics. Not only do they capture attention, but research shows infographics also boost engagement, website traffic, and SEO efforts when done correctly.
This comprehensive guide will cover why infographics deserve a spot in your overall content marketing strategy, best practices for creating high-quality infographics, and real examples you can model.
Infographics visually represent data, concepts, or ideas using minimal text combined creatively with charts, graphs, illustrations, or other graphics. They transform complex information into easily digestible visual bites.
Well-designed infographics pack in more information per square inch yet simplify and clarify, making recall quicker and longer-lasting.
There are several key reasons infographics can take your content marketing results to the next level:

Humans are visual creatures; our brains process images 60,000 times faster than text, according to studies. We’re naturally drawn to imagery, color, and design over big blocks of text.
Infographic design caters perfectly to this tendency by turning statistics, data, and words into colorful, attention-grabbing graphics.
Interactive infographics convey messages to readers within the average human attention span of 7 seconds, making it easy for them to learn information. The more a visitor engages with your content, the more likely they are to convert or come back to your site.
On their own, stats and figures don’t always paint the full picture. Sprinkling numbers throughout paragraphs of text doesn’t always resonate either.
Infographics allow you to visualize data to tell a story that sticks in your audience’s minds. For example, by creating a timeline of events or transformations over time,.
Weaving data into a narrative framework through infographic design also helps simplify complex topics by highlighting only the most essential information.
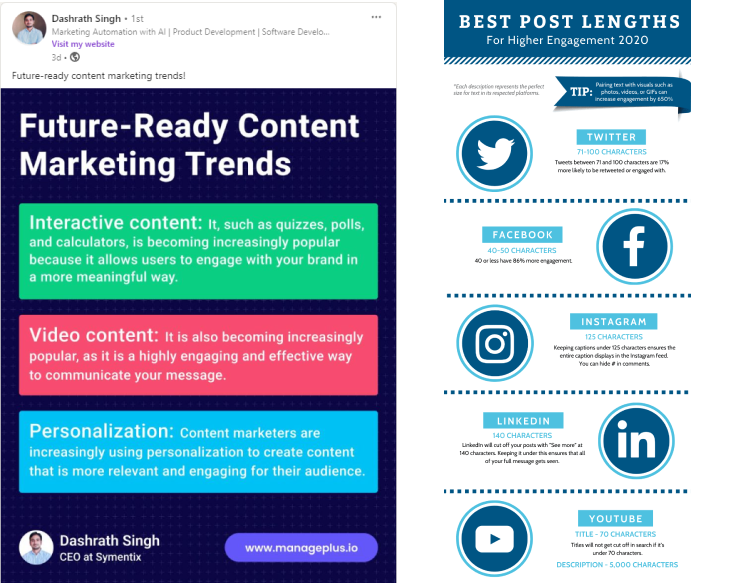
Infographics lend themselves perfectly to social media platforms in size and visual appeal. Various studies show social shares of infographic content far exceed text-only posts.
One experiment published in the International Journal of Market Research showed that including infographics in Social media content marketing increased social shares by 850%!
Driving social shares not only expands your reach and referral traffic but also signals search engines that your content offers value.
Human minds retain visual information better than text alone, with several experiments showing we only remember about 10% of what we read but closer to 65% of what we see.
When you combine statistics and other facts with bold colors, illustrations, charts, and other graphics, it sticks in your audience’s mind longer. They’ll be more likely to recall your key messages and solutions later, when needed.

High-quality infographics that offer value attract links, embeds, and social shares—all powerful SEO ranking signals for search engines like Google.
An experiment by marketing company MDG Advertising revealed infographics they published attracted 11X more links than text-based content with the same subject matter.
Populating your site with infographics on popular topics within your industry allows organic search traffic and rankings to steadily improve over time as more links flow back to your domain.
Infographics provide an ideal “canvas” to reinforce your brand throughout the design.
You can display your company colors, logo, iconography, and typefaces that match your brand guidelines to subconsciously cement your brand. Even if shared widely or published on a different domain, viewers will identify it as belonging to your company.
Over time, as your infographics rack up views and engagement, brand awareness and perception of your business build. You become viewed as a prominent voice and industry leader.
Also Read | 16 Paraphrasing Tools List To Improve Content Quality in 2024

Now that you know why infographics deserve a spot within your content marketing mix, let’s cover some tactical tips and infographic design principles to employ:
The first step is to thoroughly research your topic to determine what information would be valuable to share visually. Think about what questions your target customer has and what information would help them solve problems or learn something new.
You want data and statistics that are timely, accurate, relevant to the topic, and ideally from trusted third-party sources rather than self-created. Data visualization best practices say to simplify complex data sets down to the essentials your audience needs to grasp key takeaways.

With the data and information gathered, next decide which visual medium would communicate it most clearly and engagingly:
Compare different infographic design layouts and visuals against your information to determine which fits best. The right visualization method clarifies rather than obscures meaning for readers.
While conveying information accurately is vital, infographic design matters too. Use compelling:
These design choices keep your infographic interesting while guiding your audience through the narrative and supporting brand building.
The text still plays a major role. Write descriptive yet pithy headlines, subheads, intro paragraphs, and captions to orient viewers and link graphics back to key points.
Avoid walls of dense text; use text sparingly to annotate graphics or highlight essential big-picture concepts. Reduction drives retention and recall.
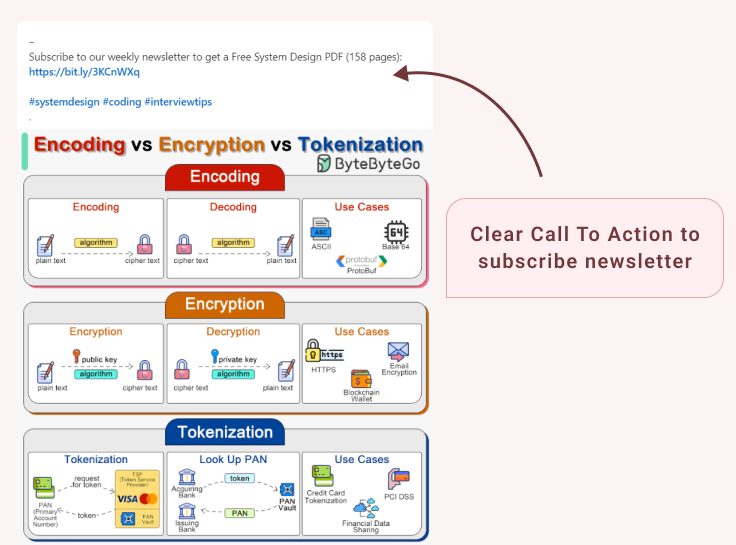
Infographics shouldn’t just convey information; they should drive conversion goals. Close each infographic with a clear call-to-action, like:
CTAs turn passive content consumption into business results. Make them easy to spot and describe tangible value.
Infographics deserve a spot in any savvy content marketer’s playbook thanks to their ability to boost engagement, storytelling, recall, social amplification, SEO benefits, and brand identity.
While crafting effective data visualizations requires strategically consolidating information and deliberate design choices, the impact can far outweigh purely text-based content.
As you test and refine various infographic topics and formats, doubling down on the highest performing graphics can compound awareness, traffic, and ROI over the long term.
Now that you know how and why infographics can supercharge your digital marketing results, why not brainstorm ideas for your first one?

Streamline your marketing efforts with AI-powered working design — Organize, collaborate, and optimize your marketing campaigns all in one place!

Join now to shape the future of MangePlus
Don’t miss out

Content Writing | SEO | SEM